

Bluescope Steel (ASX:BSL) - Deep Dive
Bluescope Steel (ASX:BSL) - Deep Dive
Global Steel Company

About
BlueScope is a global leader in premium branded coated and painted steel products - the third largest manufacturer of painted and coated steel products globally.
Our track record of successful global partnerships enables us to prosper in widely diverse markets. In India, we have established a joint venture with the highly respected Tata conglomerate, and our joint venture with Nippon Steel - BlueScope Coated Products – is opening exciting new markets and opportunities in Asia
Equally important are our successful partnerships with our customers. Many of our customers are Fortune 500 companies, and we can help them realise significant savings in the total cost of their buildings by reducing construction schedules.
Our global networks are another great BlueScope strength, with more than 100 facilities in 18 countries, employing around 14,000 people serving thousands of customers.
Strategic Focus
We will drive growth in premium branded coated and painted steel markets in Asia Pacific, and build on the strong value proposition we offer customers across the Pacific Rim from Asia, Australia, New Zealand and to the west coast of North America.
In our engineered buildings business we will drive BlueScope Buildings growth. We have a distinctive capability in engineered buildings and are a market leader in the two largest markets, North America and China.
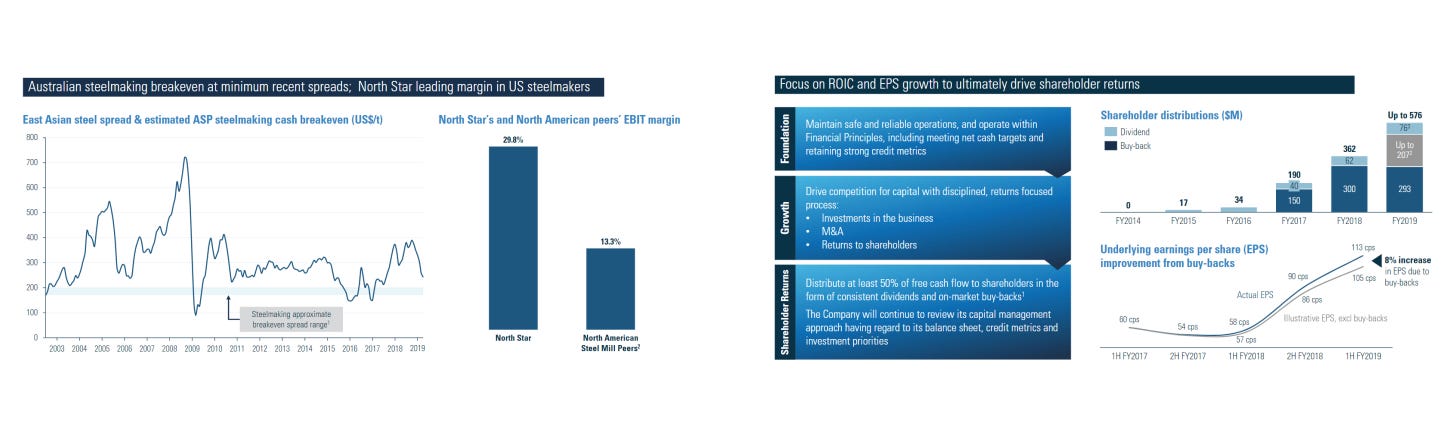
North Star BlueScope Steel is the best performing steel plant in the US, and one of the best in the world, delivering consistent financial performance and strong returns on invested capital. The business is recognised by customers in the independent Jacobson survey as the leading mini-mill in the US based on quality, service and on-time delivery.
BlueScope is committed to deliver value from steelmaking in Australia and New Zealand by remaining cost competitive and continuing to deliver value through the cycle.
Financial strength is a core pillar of our strategy, and supports value creation for investors. BlueScope’s framework for value creation is based on quality of earnings, returns on invested capital, credible growth plans and the strength of the balance sheet.
Key Financial Performance
As outlined in their strategic focus, we can see that Bluescope emphasis a strong balance sheet, quality earnings and returns on invested capital. Over the below 16 year time frame since IPO these have generally been attractive, while tangible book value is on an upward trajectory with a CAGR of 3.18%.

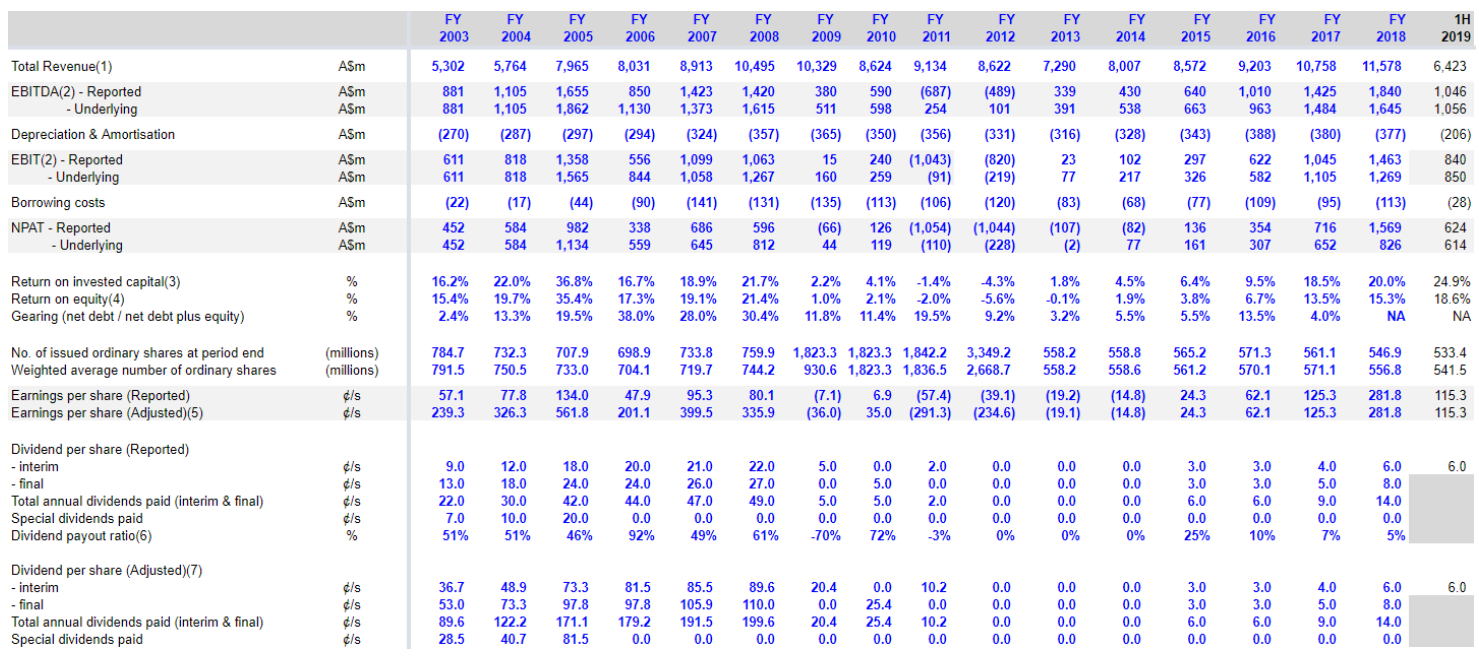
What Happened from 2009-2013?
As you may know, In 2008/09 the Global Financial Crisis occurred. This was the greatest downturn in industrial output since the second world-war. Bluescope quotes the following in their 2009 Annual Report:
“Dear Fellow Shareholder,
The 2009 financial year will be known for the greatest downturn in global industrial output in post-war history. No one was immune from its effect. For BlueScope Steel, it was our most challenging year ever. We acted promptly by cutting costs and reducing production in the face of falling demand and prices. But we were not distracted from the fundamentals of our business – staying safe, protecting our balance sheet, building brands, improving efficiencies and enhancing customer service. Now, in the first quarter of the financial year 2010, we are seeing moderate improvement in demand and prices stabilising in some markets. But there is still a way to go before a full recovery in global and domestic steel markets takes hold. At BlueScope, we are ready for the recovery and well positioned to take advantage of a growing and more confident market. The first quarter of FY09 began with very strong demand and pricing for hot rolled coil and slab products, delivering a record first quarter performance. But as global market conditions rapidly deteriorated in the second quarter, export and domestic demand declined. Benchmark hot rolled coil prices nearly halved by the end of December, while prices for steelmaking materials, iron ore and coking coal, remained at record high levels, leading to severe margin compression.”
As can be seen from their declining tangible book value, the period was a tough few years as they suffered decline in equity. To remedy this, they committed wholeheartedly to turning the company around via conservative gearing, strong liquidity and cost reductions. In addition to this, the 2011 report mentions a restructure involving the drawback from the Australian export business. The next 2 years saw a huge reduction in Net Profit as a result of Asset impairments and restructuring costs.
Did they deliver?
In the 2012 Annual Report Chairman Graham Kraehe announced the completion of the restructure in addition to a joint venture with Nippon Steel Corporation and diversifying their operations to Asia, Australia, New Zealand and the US.
As can be seen from a rapidly growing NPAT and ROIC, this was an excellent initiative by management and reassures my confidence in management. Time remains to be seen of Bluescopes performance in the bottom of the commodity cycle, however I am confident that management is well-equipped to sail me through a storm.
Business MOAT Analysis
This is an area where commodity focused businesses can not add value. High Quality Monopoly-like business is highly unlikely to be achievable for BlueScope given the low barriers-to-entry and non-existent switching costs.
I’m certain Bluescope is aware of these limitations, and so focuses on the shareholders as a result. Capital growth Investments and Shareholder returns) is a priority for them.
A focus on these profitability metrics correlates directly with cost competitiveness, which Bluescope happily boasts it’s achievements in that area.
Input Costs
Iron Ore - The recent price gain in Fortesque Metals Group ASXFMG makes sense given the booming price of iron ore. Iron ore is an input cost for steel, as such can be seen as a natural hedge to iron ore prices. Bluescope has outlined that it expects 2H2019 Profit guidance to be softer as a result of rising iron ore prices. The operating margin spread between Fortesque and Bluescope in the chart below is a clear indication of this.
Coal - According to Whitehaven Coal ASXWHC their forecast for coal is that Asia will be the dominant demand driver and premiums will increase over time as barriers to entry are erected due to lack of new mines. This will translate to increasing input costs over time for Bluescope, however, if Bluescope is efficient in their cost cutting developments this will likely offset this factor.
Limestone - The majority of lime production actually comes from China and is likely to continue growing fast. Which again, makes sense given Bluescopes operations in China. This is identified as quite a large risk as Bluescope's strongest performer is North Star in North America. Chinese Tariffs could directly impose a threat to Limestone input costs, impacting the performance of North Star's underlying ROIC.

All 3 Markets identify a highly competitive space, leaving a difficult to manage cost reduction policy. As Bluescope has likely recognised, they have shifted their growth plans to efficiency in the form of automation to reduce operating costs further in anticipation for raw materials volatility.
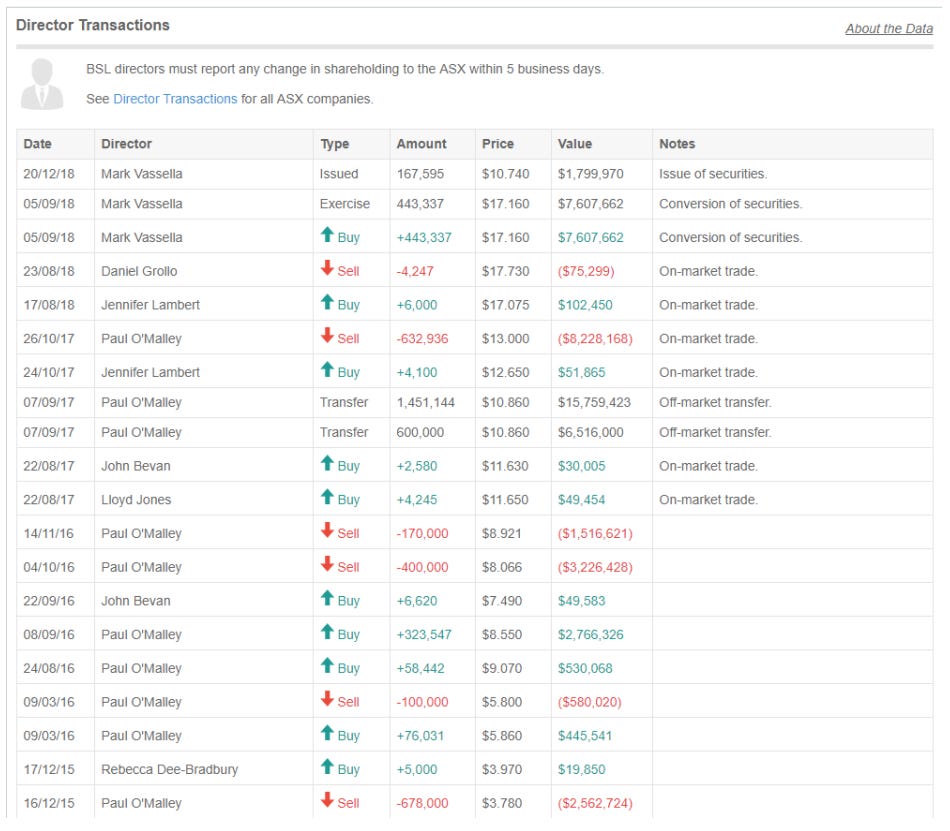
Insider Trading
The switch of CEO from Paul O'Malley to Mark Vasella correlates with the large trades in recent times. Therefore it is not an issue. Besides this, activity is relatively low with no trades in the last 6 months.
Risks
So we can be confident of the aptitude of management to do what they say. All is well and good in this regard. However, before investing, we need to know of any catalysts that may drive an appreciation or depreciation in the share price.
Appreciation Catalysts
Share Buy-backs will increase the value of shares held.
Investments in Robotics. E.g. Automated Cranes AUS, Coil robots US & Asia), automatic welder US. This will drive efficiency in operations, cutting costs and increasing profitability margins as a result.
Increasing Profitability Margins.
Depreciation Catalysts
Sovereign Risk US and China)
Competition from peers.
Black-swan events
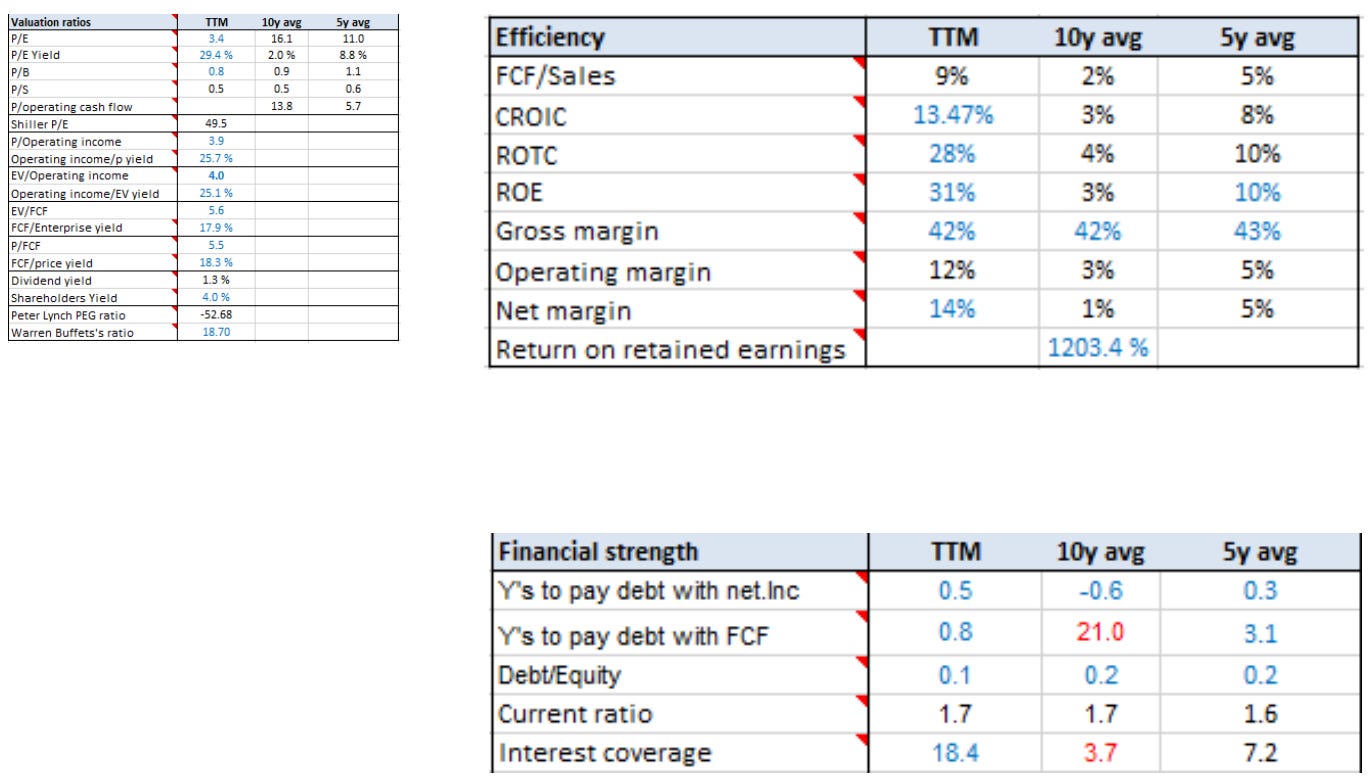
Fundamental Analysis
As can be seen below, Bluescope offers very strong financials that correlate with their core strategy.
'Strong balance Sheet' - 10% Debt/Equity, 1.7x Current Ratio, 18.4x Interest coverage and plenty of liquidity to pay their debt
'Returns on Invested Capital' - 28% YoY is excellent. 4% 10y average can be explained due to their restructure and the GFC.
'Quality of Earnings' - Margins are consistently profitable over the long term. 10Y Averages)
Peer Comparison
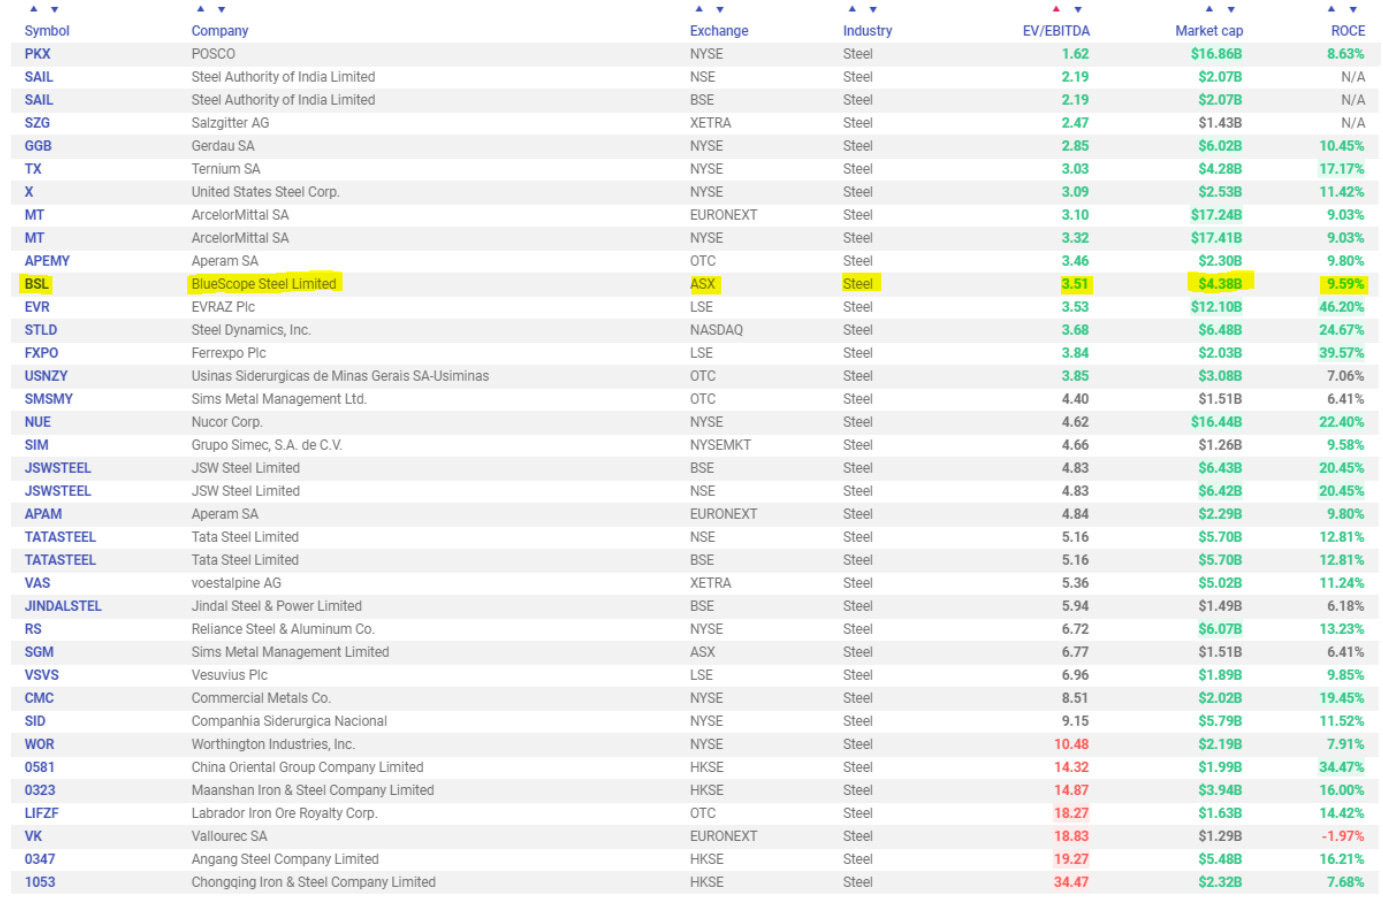
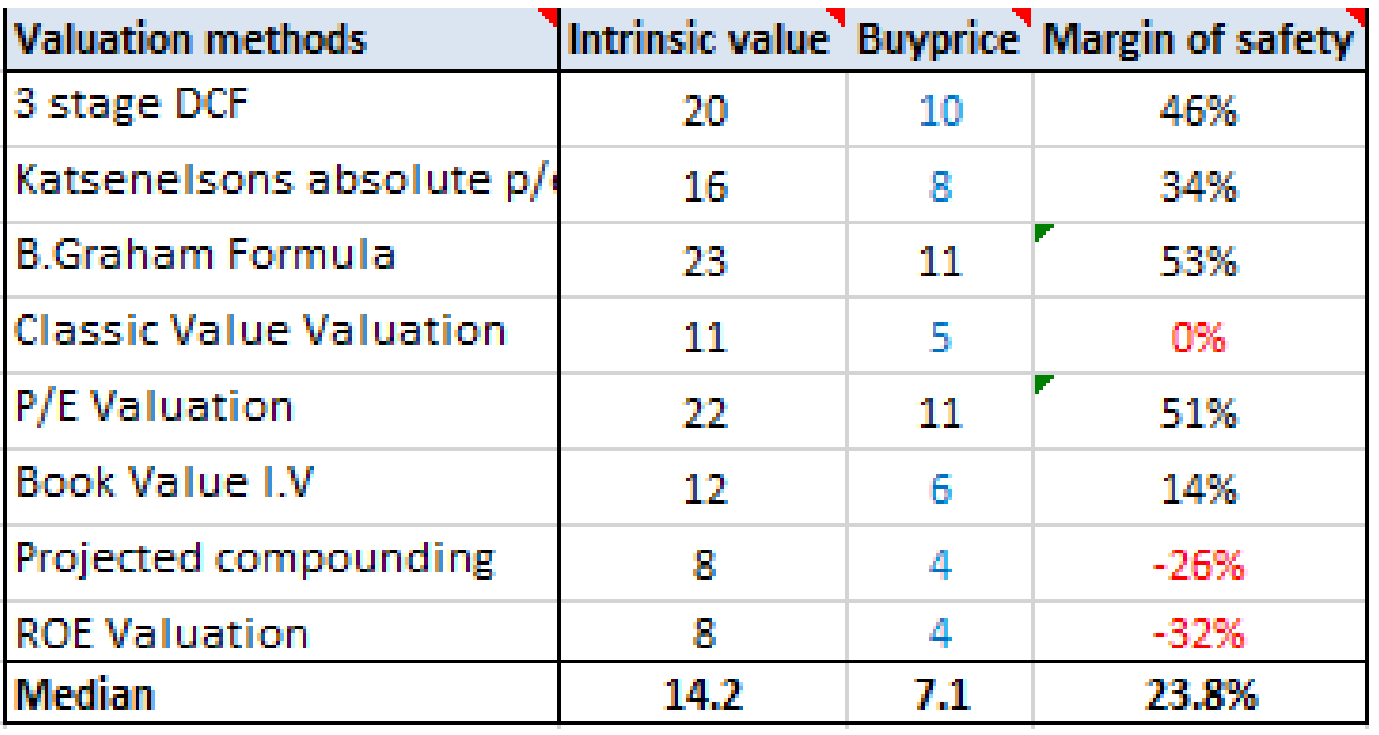
Intrinsic Value
To estimate the intrinsic value of Bluescope, i use a spreadsheet template that includes several different methods and import fundamental data from morningstar. These methods are then used to find a median intrinsic value of the stock. On this calculated Intrinsic Value a 50% Margin of Safety is Ideal.
Assumptions:
Risk-Free Rate = 3.0%
Discount Rate = 15.0%
Current Stock price = $10.63
EPS/FCF growth = 6% Taken from latest profit guidance)
Equity Growth = 3% Long Term book value growth)
10Y PE = 16
Bluescope indicates a 24% Margin of Safety and an intrinsic value of $14.20 per share. If all factors remain the same, this will be a safe price to sell given these conservative assumptions.
Conclusion
Bluescope represents great value at the current price. However it may take some time for their projects to be completed and translate to value. If buybacks keep happening my current shareholding will increase in value in addition to receiving dividends. Major risks are those of trade tariffs, blackswan events and International steel competition. Management is reliable over the long-term and a focus on Shareholder return and Cash flow-positive results is reassuring to shareholders. This review is to re-done on the 6/06/2020 If i have not sold the stock.