If you’ve been following my one page pitches, you’ll notice i’ve started to rely on using a shorthand method where i get div yield + growth and compare it to the PE ratio, both including and excluding net debt. This post will be some musings on the power of the multiple, and how I am using it.
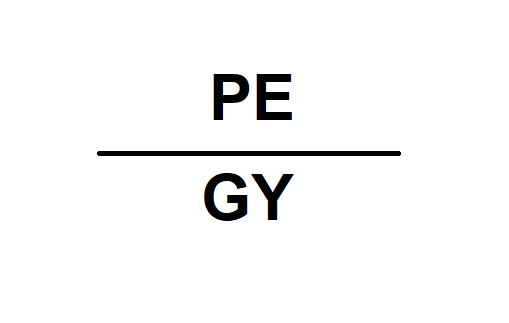
First the ratio itself was devised by legendary investor Peter Lynch and is calculated as below, where ‘GY’ is Earnings growth + Dividend Yield’:
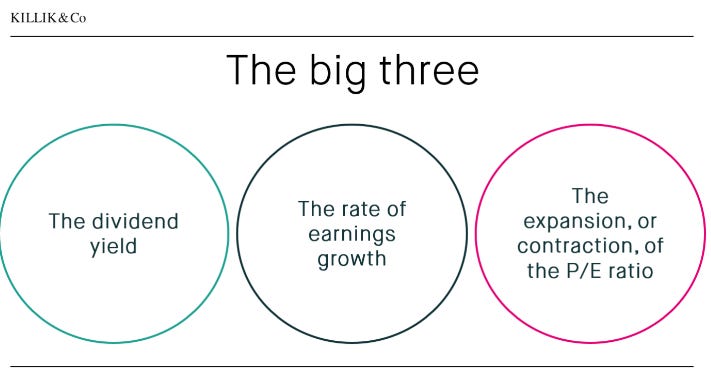
It’s very simple, and I think it incorporates all the key areas where stock returns can come from, which can be distilled into 3 key areas:
Now you can substitute some of these for example the earnings growth and P/E for the book value and P/B for example, but generally you can use reverse engineer basically any investment outcome using these variables.
The reason the PEGY ratio is so powerful is because if you take it to the extreme, in my view it will prevent you from overpaying and hopefully avoid poor outcomes. The main thing that needs to hold true is your assumptions and how sound they are. If you use this with highly predictable businesses, it should end up proving highly successful.
Of course, as with any ratio it’s just a number, and has plenty of shortfalls, such as lack of considerations in the capital structure department, which generally will take a bit of work to get through. Although all i intend to use this for is a quick check and monitor overall portfolio levels.
I also think it’s reasonably useless to use this with trailing figures, rather you should use this as a shorthand valuation approach using your own business assumptions. I just use trailing numbers in the stock pitches to avoid any sort of overly promotional pitching, those posts are generally to train my sourcing and idea generation in quick succession and quality of recognition in short order.
So with that said, some real world examples from my own portfolio, and I will use statutory figures for this, and the benefit of hindsight.
Kelly+Partners (ASX:KPG)
When i purchased Kelly+Partners back in 2019, it had the following:
Traded at 92c
16c in debt
7c in earnings (13x TTM PE, 15x inc debt)
6c fully franked dividend (6% yield)
From 2019 to 2022 we saw EPS grow at a rate of 24% p.a.
So you would of been presented with 0.50x PEGY (inc debt) respectively assuming you made these assumptions. Personally my own assumptions were to grow 15% p.a. so what i was looking at was 0.71x. Still a strong ratio. Today it trades closer to what I estimate to be a 1.70x ratio, indicating a ~2.5x stronger valuation.
So i’m using this as a filter, and I think 0.5x is a good hurdle to consider. If i find a stock returning 10% a year into perpetuity through earnings and yield, I need to buy it below a 5x PE, similarly if it grows 20% with dividends into perpetuity, I need it below 10x. Very difficult hurdles to meet. But I have what I think are 4 in my portfolio of 8 stocks.
Hope this was remotely interesting, If it wasn’t that’s okay… Thanks for reading!


This is great. Thanks Tristan. Is including buybacks beyond the scope of the process?
Hello, i just wanted to ask how you calclate P/E with debt and also why to multiple the PEGY with 0.5
P.S Very nice article thanks for sharing.