

Spark Infrastructure (ASX:SKI) - Deep Dive
Spark Infrastructure (ASX:SKI) - Deep Dive
Australian Energy Infrastructure

About
Spark Infrastructure owns leading essential service infrastructure businesses.
Our businesses help meet Australia’s future energy needs while delivering strong returns to Securityholders and driving innovation through efficient investment.
We have interests in $17.1 billion of energy network assets in total and a workforce of over 5,300 employees. We deliver energy to more than 5.6 million customers across three states, in addition to transporting electricity across the NEM between New South Wales and Queensland, Victoria and the Australian Capital Territory.
Strategic Vision
Create long-term value through capital growth and distributions for Security holders from our portfolio of high-quality, long-life essential service infrastructure businesses.
Spark Infrastructure’s strong financial performance has been achieved by optimising business performance, capitalising on organic growth opportunities and diligently considering external growth opportunities.
In evaluating opportunities, we seek value-accretive growth through both acquisition and/or building business platforms.
Our strategy is supported by proactive engagement strategies which ensure we have an active voice with regulators, government and other stakeholders to represent our investors’ and industry interests.
We are delivering against our strategy while continuing to invest in innovation and connecting a strong pipeline of renewable energy opportunities.
Our strategic priorities
Value enhance - Underpinned by rigorous governance and risk management processes, we manage our investment portfolio for performance, and invest efficiently to capitalise on organic growth opportunities through underlying RAB, unregulated businesses and assets and the one-off contingent transmission projects in TransGrid, such as those outlined in the AEMO Integrated System Plan ISP.
Value acquire - We continue to seek out and evaluate opportunities to grow and diversify our portfolio through disciplined acquisitions.
Value build - We look to develop adjacent business platforms arising out of the technology, climate and customer-driven transformation occurring across the industry.

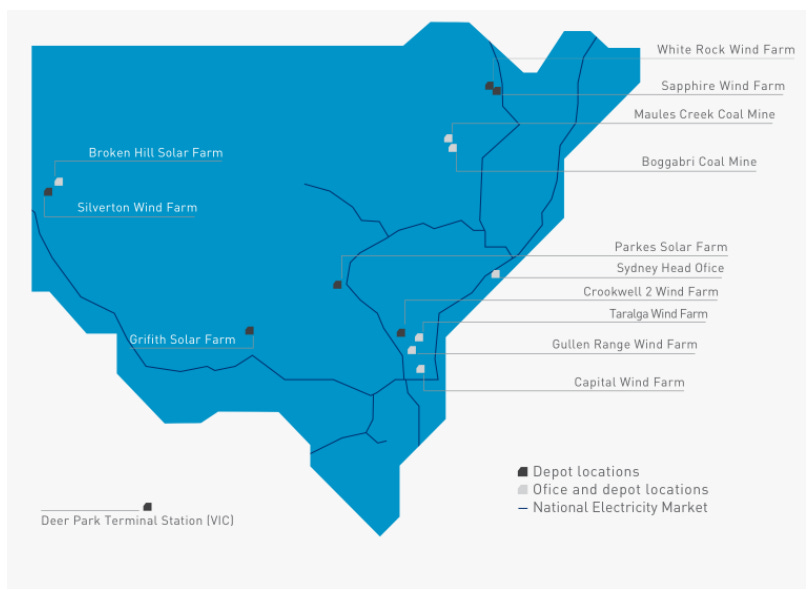
Spark Infrastructure Assets
SA Power Networks (49% interest)
SA Power Networks is the sole operator of South Australia’s electricity distribution network, supplying around 877,000 residential and commercial customers in all regions and the major population centres.
Victoria Power Networks (49% interest)
CitiPower operates the distribution network that supplies electricity to around 330,000 customers in Melbourne’s CBD and inner suburbs. Powercor is the largest distributor of electricity in Victoria, operating a network that serves around 810,000 customers in central and western Victoria and the western suburbs of Melbourne. CitiPower and Powercor together are known as Victoria Power Networks.
Transgrid (15% interest)
TransGrid is the largest high-voltage electricity transmission network in the National Electricity Market NEM by electricity transmitted. Its vast 13,000km network connects generators, distributors and major end users in New South Wales and the Australian Capital Territory. It supplies power to more than three million homes and 600,000 businesses and forms the backbone of the NEM connecting Queensland, New South Wales, Victoria and the Australian Capital Territory.
Efficient Scale Via Regulated Infrastructure
SA Power Networks
SA Power Networks is South Australia's Sole electricity Distributer, delivering power to around 860,000 Customers. Furthermore they take about 25% cut in each electricity bill of these customers, leading to very predictable revenues from this section.
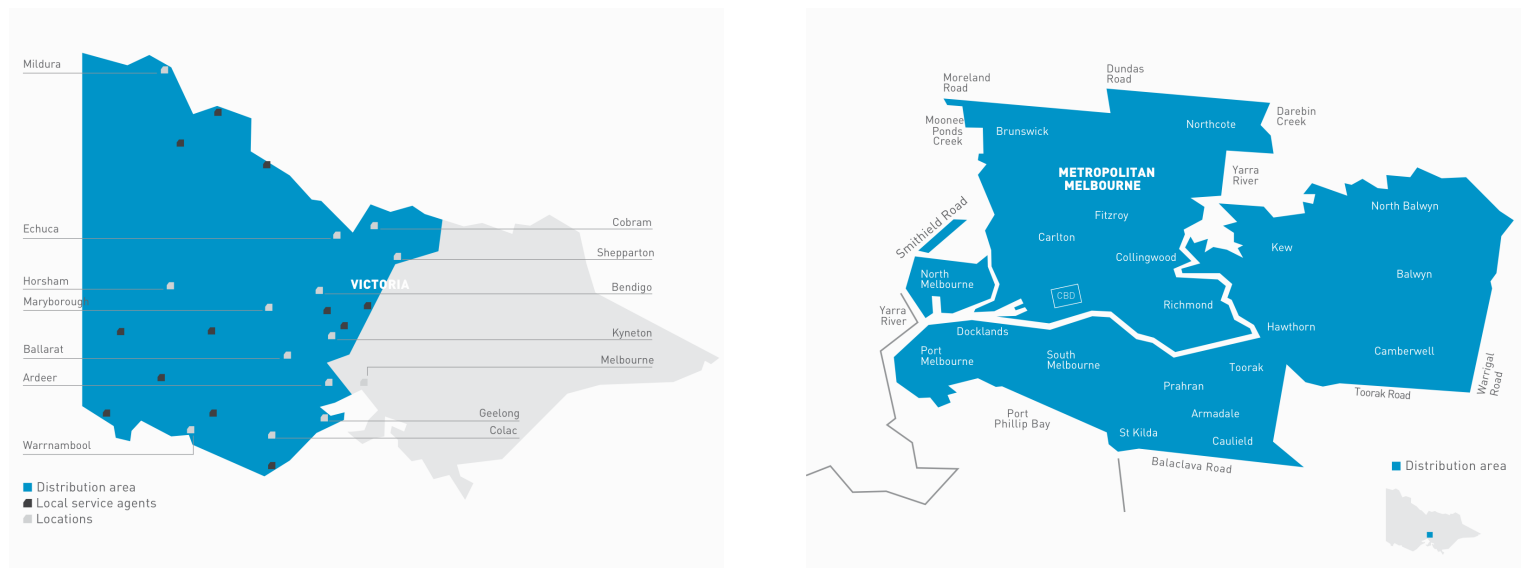
Victoria Power Network
Powercor and Citipower both service Victoria and make up Victoria Power Network. Unlike South Australia it is not the sole distributor of electicity. Other Networks are owned by Ausnet, Jemena and United Energy.
Citipower is a significant asset as it powers the CBD of Victoria's capital city, Likely the most valuable in the state. At Just 157 square Kilometre.
Powercor on the other hand is the largest distributer in Victoria in absolute terms, providing electricity for over 820,000 customers in Western and Central Victoria.
Combined, the Victoria Power Network services over 1.1m customers in Victoria.
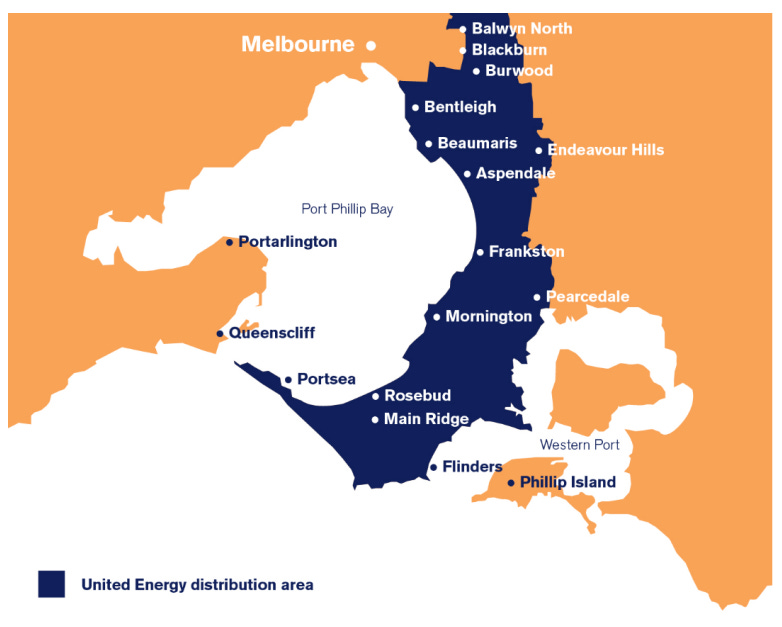
United Energy
United Energy distributes electricity to more than 660,000 customers across east and south east Melbourne and the Mornington Peninsula. Ninety per cent of their customers are residential.
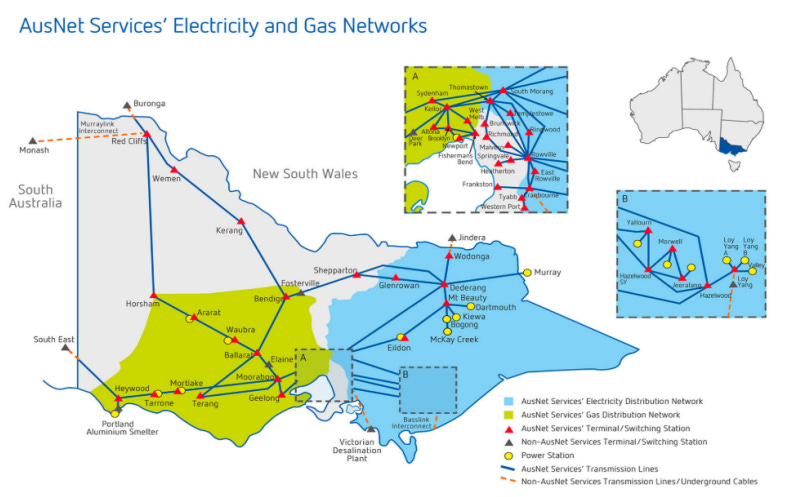
Ausnet
Ausnet owns and operates an electricity distribution network feeding lowervoltage electricity to and from more than 740,000 customers in Melbourne's north and east and across all of eastern and northeastern Victoria. We do this through almost 53,000 kilometres of powerlines and 400,000 powerpoles.
However, in saying this, Ausnet also own's Victoria's entire electricity transmission network and a large gas distribution network, giving it the advantage in diversification in Victoria. However, being concentrated only in one state means it is reliant on that one state's population growth for revenue.
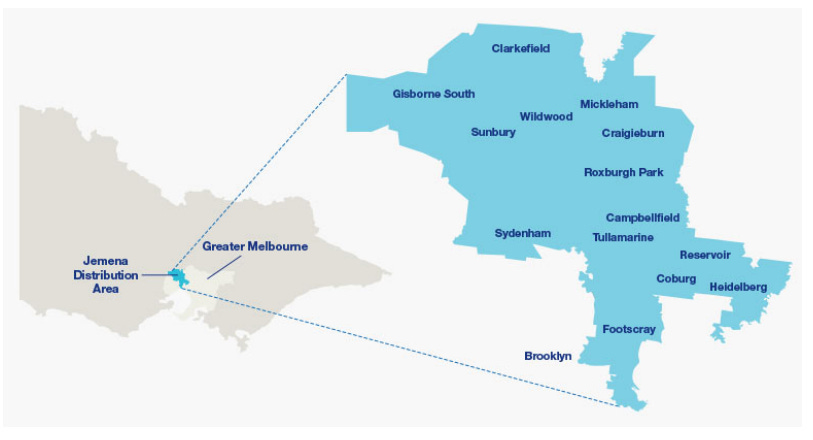
Jemena
Finally, Jemena, is the smallest in Victoria, providing electricity distribution to north and Western Melbourne at over 350,000 homes.
Transgrid
TransGrid is the operator and manager of the electricity transmission network in NSW and the ACT and is positioned centrally within the NEM connecting Queensland and Victoria.
With more than 13,000km of transmission lines and cables, 38,000 transmission structures and 105 substations, the network delivers 32% of the electricity consumed within the NEM to over 3.6 million homes and businesses in NSW and the ACT.
From the above Breakdown of the electricity Distribution network, It is clear that competition is sparse and no distribution network is in direct conflict with one another. Therefore, a natural monopoly is formed with Government allowed 'Market sharing', dividing up markets between them and having regulated pricing via the Australian Energy Regulator.
Protection against Macroeconomic Pressures
The National Electricity Law and Rules set out the regulatory framework for electricity networks. Regulated network businesses must periodically apply to the AER to assess their revenue requirements (typically, every five years). Chapters 6 and 6A of the National Electricity Rules lay out the framework we apply in undertaking this role for distribution and transmission networks respectively. The frameworks require us to set a ceiling on the revenues or prices that a network can earn or charge during a regulatory period.
In determining the revenues or prices that a network business can charge, we forecast how much revenue a business needs to cover its efficient costs (including operating and maintenance expenditure, capital expenditure, asset depreciation costs and taxation liabilities) and provide a commercial return on capital.
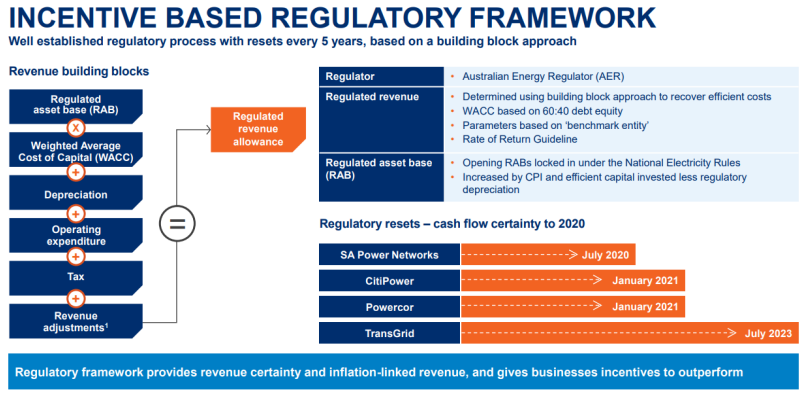
Certainty of Returns in Regulated Assets
Inflation
The regulatory asset base RAB is an accumulation of the value of investments that a service provider has made in its network. It includes assets of various useful lives. Most of these assets depreciate in value, although a small number (such as easements and land) do not. The return investors receive on their assets should reflect the risks of their investment. These risks include the prospect of inflation eroding the investor’s purchasing power. An allowance for expected inflation provides compensation for this risk See the Bibliography for a Fact Sheet on RAB Indexation).
Population Growth
To see the Source of Population Growth estimates. Check the 'Victoria in Future' Document in the Bibliography Peak Demand Growth
Peak Demand Growth
The Australian Energy Market Operator AEMO publishes electricity demand forecasts as part of planning analysis to inform the market and policy-makers about the generation that will be needed to balance projected demand.

Value-Added Growth in Unregulated Assets and change in generation source.
The Unregulated area of renewable presents a significant opportunity for growth and innovation with a number of investment opportunities currently in the pipeline.
This initiative is a result of AEMO predictions in significant changes of the source of energy generation.
Spark Infrastructure is actively shifting their investments to accommodate a change in distribution needs as well. For example, Transgrid has been collaborating with Tesla and have delivered a 500kWh Tesla Battery at the Sydney CBD to reduce grid stess during peak demand.
For us as investors, this represents a focus on the long run, likely smoothing the transition to alternatives sources of energy in the future.

Financial Performance
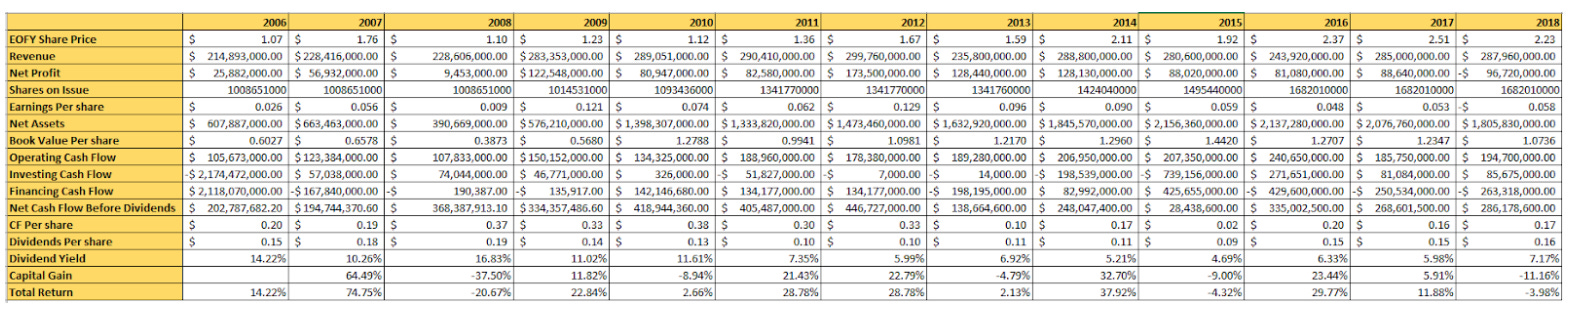
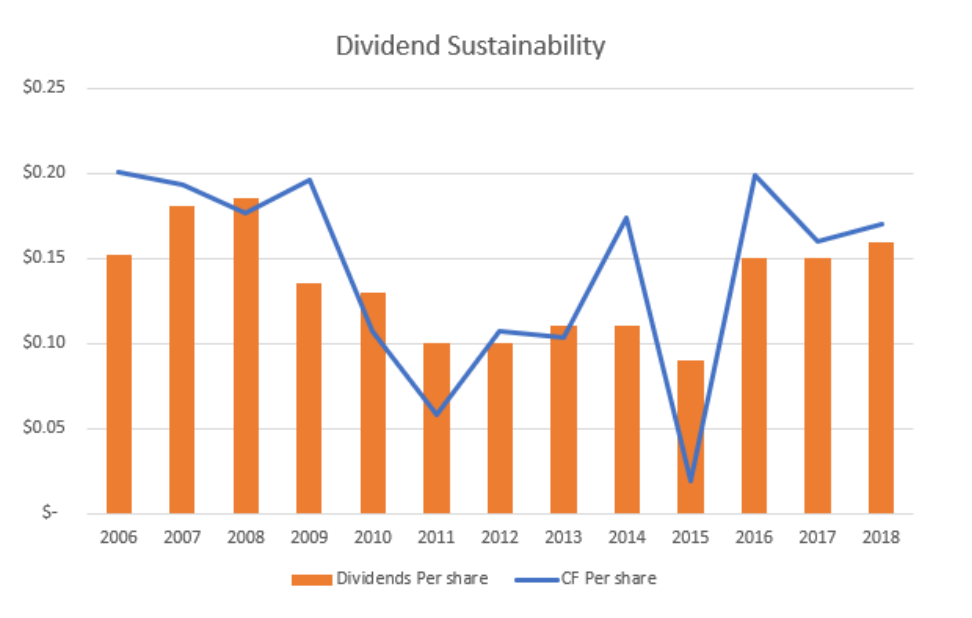
Dividends and Share Capital Historicals
Dividends of Spark Infrastructure have been remarkably stable over the years, with an average Dividend per share of 13c and a standard deviation of +- 3c per share. With this in mind, buying at a price of $2.36 we can expect the dividend yield of between 4.2% and 6.8% on this cost base.
Furthermore, Cash flows have been less consistent with an average cash flow of $0.14 per share and a standard deviation of 5.5c per share. It is interesting to note the cash flow and dividend remained high during times of market distress in 2008/09, resulting in a significant jump in dividend yield as the share price dropped. This presents an excellent opportunity to add to the position in times of market uncertainty to reduce our cost base and provide attractive yield.
The company is sensible in it's capital management in the fact that capital is issued while share price is rising. Between 2009 and 2018 we can see an increasing amount of shares on issue, however to offset this fact, the share price has continued to increase. This points toward the conclusion that a rising share price means share issues are more and more valuable, which the company has capitalised on.
This has caused the company to grow it's asset base over time. Between 2009 and 2018 The shares on issue have grown by 63% while the book value of the company per share has grown by 89%. Given a payout ratio of almost all of their cash flows year on year, equity financing makes sense and does not destroy value to shareholders.


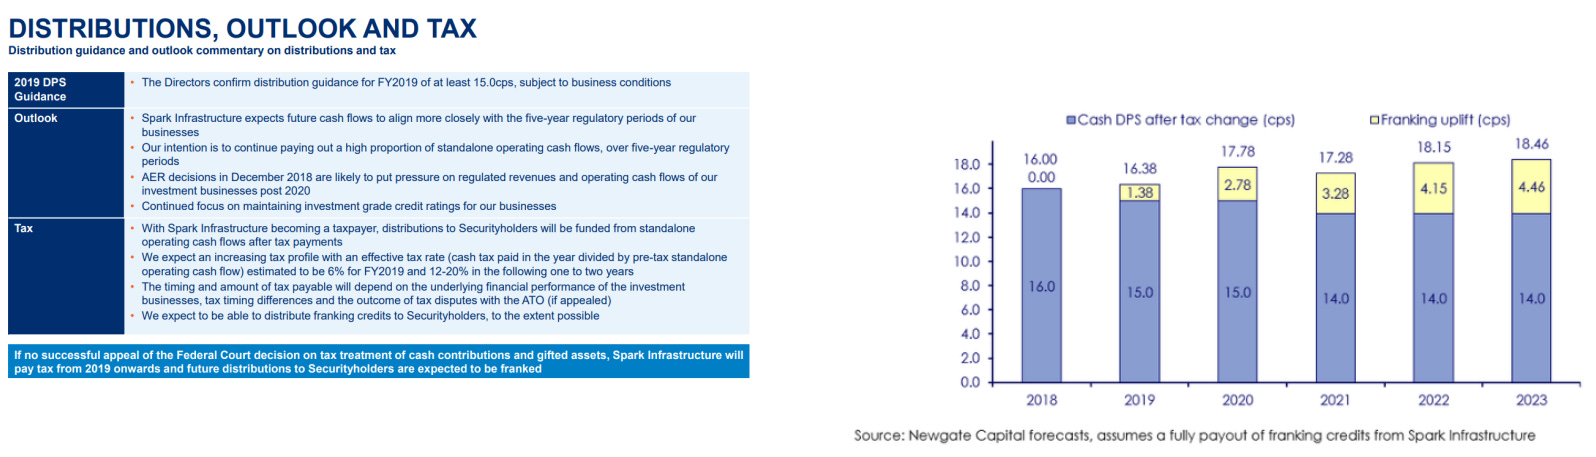
Distribution and tax outlook
The outlook to FY 2020 is clear as regulatory resets are due from FY2021 onwards. This gives a clear outlook on guidance in dividends likely to remain around the 15c point.
Furthermore, Spark Infrastructure is expected to become a tax payer this year, which is likely to affect their revenue as a result. Spark has been investigating ways to reduce the impact of this change via Depreciation and capital expenditure treatment.
To us as investors, the tax paid by the company is likely to be passed on via franking credits and given their near 100% payout, the impact is likely to be negligible.

Valuation
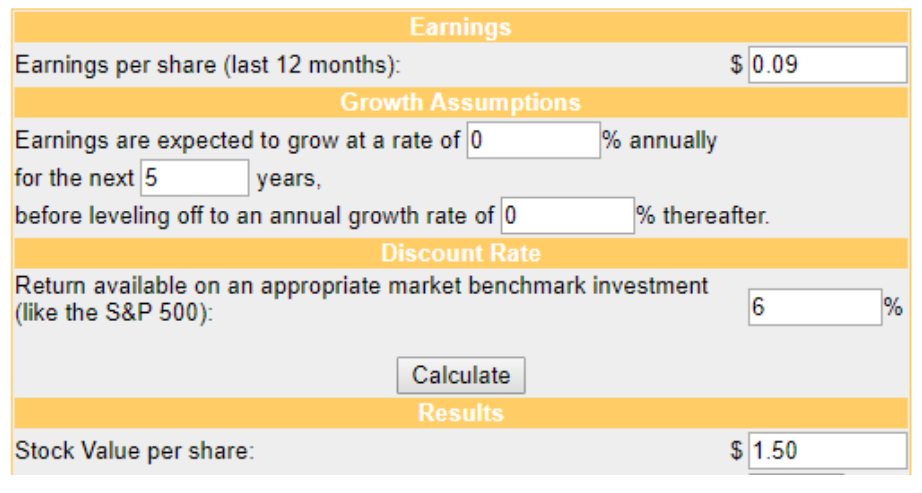
Given the stable nature of the business. I will discount the average cash flows given earlier with each standard deviation scenario made. I also won't price in growth and will use Spark's WACC 5.63% in the February 2019 Investor Presentation rounded up to 6% to be conservative.
Normalised Cash Flow Situation
Assumption = $0.14 Cash Flow per Share
Unsuprisingly this outcome has yielded a valuation that is essentially the same as the current share price. It seems that given the ease of valuation, efficiently priced shares are a given.

Standard Deviation - 1
Assumption = $0.085 Cash Flow per Share
If the Stock were to provide this cash flow to investors, now would be overpriced.
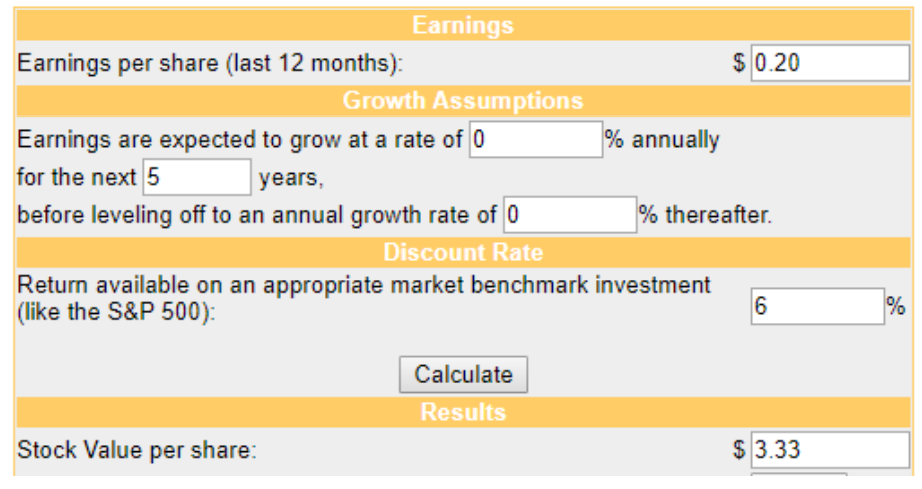
Standard Deviation + 1
Assumption = $0.195 Cash Flow per share
If the Stock were to provide this cash flow to investors, now would be underpriced.
Conclusion
Spark Infrastructure has a place as a defensive asset in a portfolio with regulated revenues that provide certainty of cash flows in the long run. Furthermore developments are in place to cater to a developing energy industry in renewables etc. Competitors are virtually non-existent given the arrangement of distribution maps all seem to avoid the jurisdiction of any other energy distributor. This makes for a sharing of the market rather than direct competition. Also, Dividends are so stable that it makes an excellent stock to accumulate if the stock price was to fall drastically as the dividend yield spikes due to it not being tied to market factors thanks to it's moat and essential service nature. Valuation is largely fairly priced as is, it seems that Mr Market manifested itself in 2008/09 and a simple look at the dividend yield would have allowed you to pick up this stock cheap. Therefore the dividend yield will be my proxy for buying more shares in the future.