

Financial Modelling

Today I’ve been stress testing a template for valuing stocks. This is entirely customised to me, and my investors so keep that in mind. First, I assume we all know that as ‘value investors’ the core assumption is that the critical investment factor is determining the Intrinsic value of a business and paying a price below that, otherwise called buying with a ‘margin of safety’.
“Intrinsic Value can be defined simply: It is the discounted value of the cash that can be taken out of a business during it’s remaining life”
~Warren Buffett
With this core value in mind, you can move forward with the underlying goal of finding businesses trading below their margin of safety. I am going to move on with the assumption that we all know how businesses work, otherwise this post will be extraordinarily long.
Now, this Substack is called Hurdle Rate as it is the key determinant in the link between valuing a company and actually generating high returns. The term was drawn from none other than Constellation Software’s Mark Leonard, as explained in the About section.
This rate has taken a core position in the way that I invest, with a personal pre-tax hurdle rate of 25%+ required for all of my investments. This is a non-negotiable figure, a notion reinforced by Constellation themselves as quoted by a former M&A Executive below:
“Constellation has strict hurdle rates and buy on an internal rate of return basis rather than on multiples. If you are at 24.8%, you need to find a way for it to be 25 or that deal will not happen. In the private equity world, if you're short, you simply throw in more money to get the deal done. That's the reason for their return and share price performance. They're disinterested in making 15% IRR; if it is not 25%, you hold your nerve and look for other businesses.”
~ Former M&A Executive, Constellation Software
Of course, without a thorough knowledge of the underlying business that you are considering investing in, all of your assumptions will prove to be rather useless. That is why I focus on my core circle of competency. I want to be in the top 5% of knowledge of all shareholders in order to correctly forecast as accurately as possible in order to minimise the variance to my modelling over time and maximise consistently high returns.
Of course, even with an above average knowledge of that business, there is the chance that your assumptions can still prove to be wrong, either due to being misinformed or even undetectable future events. For this reason, an investor should diversify to a reasonable extent.
The one caveat here is that as investors we are working with public quotes. Therefore, the market quote can vary quite significantly both above and below your estimate of intrinsic value, and as a result investment consistency is difficult to maintain. For example, my model of Kelly+Partners at the end of this write up proved to be extremely wrong, but in the best way possible, as the assumption of a 3x revenue multiple exit was more than realised in the first 2-3 years. My estimated Hurdle rate of 34% CAGR became an actual result of >100% CAGR.
Moving on, it’s broadly said that Warren Buffett himself does not practice DCF models, and that is to be expected given his age. But he does say that the intrinsic value of a business is its discounted cash flows. For myself, I do like to model out a business, in order to stress test my assumptions. The format of this has varied in the past, as shown in that Kelly Partners write up, and other formats such as the model in the DSW Capital post. For the most part I have used a very similar approach with the simple heuristics shown in this great twitter thread by
. The core of this is that an investments return is estimated by Cash Yield + Earnings Growth + Changes in the valuation multiple. This is otherwise referred to as the Davis Double Play.With the above contextual information, and some additional contributions by myself, I have put together a template as shown below. The example I am using for this is none other than Sequoia Financial Group (ASX:SEQ), my largest stake investment. First the assumptions.
5 Year Holding Period
Pays out 70% of Free Cash Flow as a Fully Franked Dividend
~$55m in incremental capital is invested (Incremental retained earnings + all of the Morrison sale proceeds) and results in an additional ~$13m in earnings over 5 years (~23% ROIIC), in line with their announced business plan.
On receipt of dividends a marginal tax rate of 34.5% applies, after grossing up for Franking Credits. The CGT Discount of 50% also applies.
10x EV/FCF Exit multiple.

The first thing you will realised, is that this is NOT a DCF model. It’s rather an IRR based model. This is because as an investor with a fixed hurdle rate, I will be looking to reinvest dividends as they are received in opportunities with a similarly high hurdle rate. Discounting the cash value of those dividends without the potential value of reinvesting them, unduly penalises the true value of a cash flow stream between purchase and sale.
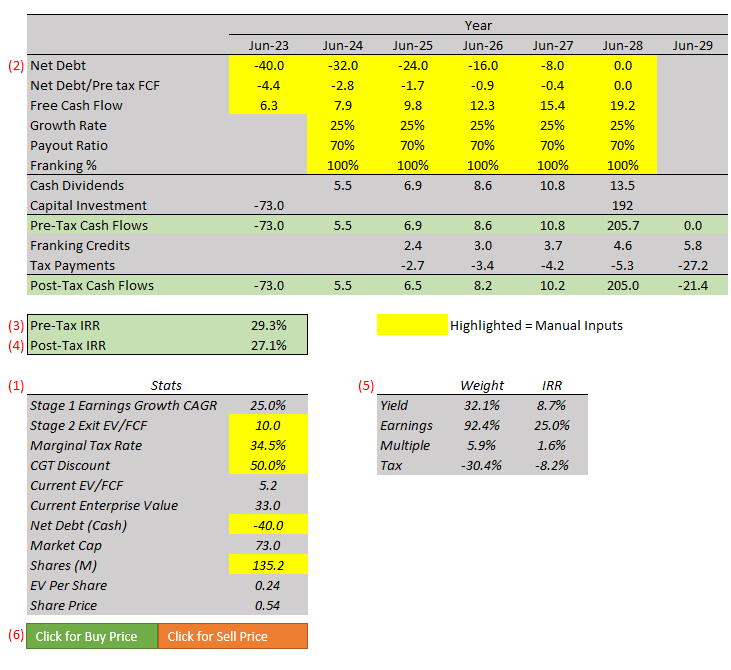
At the bottom left, you will see some statistics, the current share price is self-explanatory, the net debt figure is taken from this presentation and the share on issue is worked out from the last notifcation of buy-back. There is also some of the tax and valuation multiple assumptions made here.
Here is our key business assumptions, centered around the allocation of capital in regard to the retention of capital and the usage of debt. For the purpose of the model, future dilution or repurchases have not been assumed.
Pre-tax IRR is derived from the XIRR formula with the pre-tax cash flow stream and years shown at the top. For example, the first capital investment figure equates to the equity value (market cap), the cash dividends are FCF x payout ratio, and the final capital investment inflow is FCF in the final year, multiplied by the Exit EV/FCF less the net debt held at the end of the period.
Post-tax IRR is also derived from the same XIRR formula but includes the tax effect of the above cash flows, importantly this is from the viewpoint of an Australian investor in the average taxable income band. Tax effect is delayed by 1 year as it is typical that an investor that receives income won’t actually pay the tax on that income for anywhere between 0-2 years depending on when you receive that income and if you utilise the tax agent due date and lodgment extension to 30 June.
This is the expression of the heuristics outlined earlier. It is useful to derive how much of your return is coming from dividend yield, earnings growth, yield and how much is going back into taxes
Lastly, these buttons are Excel macros with a goal seek function which automatically changes the share price in order to solve for Pre-tax IRR hurdle rates. These hurdle rates are a buy price of 25% pre-tax IRR and a sale price of 10% pre-tax IRR. The GIF below shows this in action.

Of course, I would like to re-iterate that none of this makes sense doing if your assumptions aren’t reasonable first. I have been using this approach of a fixed 25% hurdle rate for the past 3 years of investing and it has massively improved my investing results.
I hope you enjoyed reading this, you can find a link to the calculator here if you would like to download a copy and play around with it. Please note that is a macro-enabled workbook.
This is a reminder that currently, the Hurdle Rate Substack is offering subscribers a 50% discount through to 30 June 2023 on an annual subscription at a rate of AUD $75 per year (USD $50), down from AUD $150 per year (USD $100).